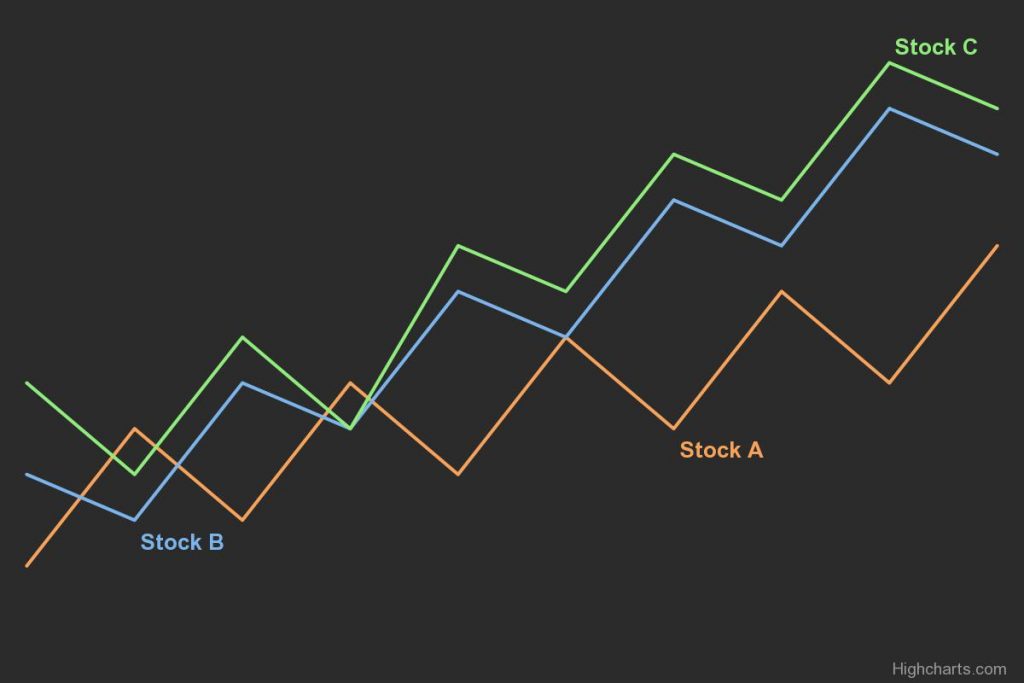
Highcharts is a powerful and flexible charting library that offers a wide range of chart types and customization options, that’s why it has been popular to create online charts. Sometimes the chart data can not be directly downloaded or even if it is downloadable, the owner may limit the data that can be downloaded. When there are a lot of data points with multiple series lines, extracting data from Highcharts by noting down the individual X and Y points is really painful.
Most of the time, the X coordinates are obvious you can generate them. The real problem is extracting the Y coordinates. In this post, we are going to discuss how we can extract the actual Y coordinates from the chart without manually pointing to the series in the chart and copying them individually.
1. Inspect Element in Browser
First of all, inspect elements of the website in your browser and locate the element for the chart and the series of data that you want to download. The d attribute of an SVG path element is used to define the path of the series on the canvas.
The d attribute or the series of data starts with <path d="M. Copy all the numbers between the inverted commas. That represents one series of data. You can parse that data to eliminate subsequent M and L elements or simply you can prompt generative AI tools like Bard or ChatGPT to remove the unnecessary part in your data.
2. Find Out Canvas Size
Canvas is an HTML element that provides a space on a web page where you can use JavaScript to draw graphics, such as charts, graphs, images, and animations. The canvas element is essentially a rectangular box that you can size and position on your web page, and then use JavaScript to draw on it. With canvas, you have complete control over the graphics that you draw, which means that you can create highly customized and interactive visualizations. Highcharts uses SVG (Scalable Vector Graphics) to render its charts. The SVG coordinates start at the top-left corner of the canvas i.e., the (0,0) coordinates for the SVG is the top-left corner of the canvas.
The viewBox attribute is used to define the position of the path on the SVG canvas. To calculate the actual y-coordinates of the path, you would need to know the dimensions of the SVG canvas and the scale factor used to draw the path.
For example, if the viewBox is defined as viewBox="0 0 600 500" in this case, the viewBox attribute specifies a canvas size of 600 x 500. To calculate the actual y-coordinates of the path, you would need to scale the y-coordinates by the height of the canvas (500) and invert them, since SVG coordinates start at the top-left corner of the canvas.
3. Calculate Scale Factor
To calculate the actual y-coordinates of the path, you would need to know the scale factor used to draw the path. To do this, divide the height of the canvas by the difference between the maximum and minimum y-coordinates of the path:
yScale = canvasHeight / (MAX(yCoords) - MIN(yCoords))Sometimes, there can be cases where minimum and maximum values are set fixed without taking care of min and max Y coordinates. In that case, we can manually calculate the scale factor testing the scale factor against the actual Y coordinates. Please look at heading 4. Calculate Scale Factor Manually.
4. Calculate Scale Factor Manually
To calculate the scale factor manually, you just need to find out the canvas size which sets the maximum Y value in the canvas, and some real Y values (more than two) of the series which you can manually extract from the graph.
You can do as discussed in heading 2 to calculate the canvas height.
To calculate the yScale, use the following formula:
yScale = (canvasHeight - actualY)/yCoord
Be sure to use this formula for more than two values and check whether the yScale is same for all the actualY values. If yScale is different for all the actualY values you have taken, then change the canvasHeight to see which set of yScale and canvasHeight gives the exact match for all actualY.
Now note the values of canvasHeight and yScale and proceed further.
5. Convert
Use the following formula to calculate all the actualYcanvasHeight and yScale calculated in the above steps.
actualY = canvasHeight – (yCoord * yScale)
Now, you have converted all the series data from d attribute of Highcharts to the actual Y coordinates.
6. Conclusion
The main point to remember is that, the SVG coordinates start at the top-left corner of the canvas and if you have sets of all the d attribute elements and few real values to test against them, you can convert all the y coordinates to actual Y values for the chart with appropriate canvas height and Y scale factor tuning them manually. You can do this in a simple spreadsheet or even use coding for automation.


